[ CHILE ]

Trade Exchange

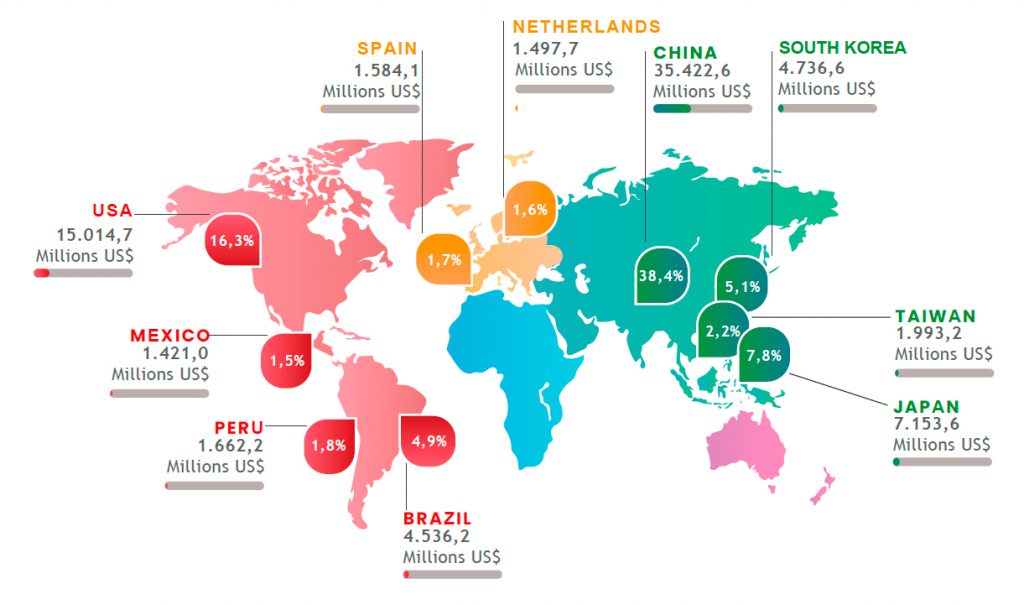
Chilean commercial exchange during the year 2021, was 171,904 million FOB dollars, figure that presented a positive variation of the 39.6%, compared to 2020. This increase is translated into a rise in the amount of the Exchange commercial of the country of 48,781 million dollars FOB.

It is important to note that the growth exhibited by the foreign trade of the country, was driven both by the behavior of the exports as well as imports, presenting both operations increments with respect to the year 2020, corresponding to the 29.6% and 53.4%, respectively.

Chilean foreign trade was mainly concentrated in Asia, America and Europe, continents that together accounted for 98.0% of total trade.
Trade with Asia during the year 2021 represented 47.8% of Chile’s global exchange, exhibiting a growth of 36.6% compared to 2020. In relation to exports to the Asian market, 78.8% it corresponded to products of the mining sector, which registered an increase of 35.7%; Within this sector, shipments of copper and copper minerals and concentrates stood out, representing 90.7% of mining exports to this continent. For its part, sales of non-mining products to Asia increased by 2.5% compared to 2020, where pulp, cherries and salmon and trout stood out within this group as the most exported merchandise.

Commercial Exchange by Continent 2017-2021

(In millions of US$ FOB)

Commercial Exchange by Continent 2021

(Participation in percentage and Amount in millions of US$ FOB)

Foreign trade of agribusiness: balance of 2021 and perspectives for 2022

The commercial exchange of Chile with the American continent totaled 62,924 million dollars FOB, a figure equivalent to 36.6% of the total exchange at the national level, which presented an increase of 48.7% in relation to the year 2020. The total amount of Exports to America increased by 41.3%, as well as sales from the mining sector, which presented a positive variation of 91.7%, where the increases exhibited by the export of copper stood out (119.0% ) and shipments of iron ore and its concentrates (136.3%).
On the other hand, imports of American products registered an increase of 55.2%, with gasoline for land vehicles and liquefied natural gas, the products that presented the most important increases, with positive variations of 414.4% and 148. 8%, respectively.

Finally, it was observed that the positive variation of 28.2% registered in the exchange with Europe was caused mainly by the 36.7% increase in imports from this continent; which generated the purchase of 3,402 million CIF dollars more, compared to the same period of the previous year. Regarding imports, the acquisitions of motor vehicles for the transport of merchandise and motor vehicles for the transport of people stood out, which registered growth of 140.3% and 132.7%, respectively; while in exports, the 34.7% increase presented in shipments from the mining sector stood out, generated mainly by the increase in copper sales to the countries of the old continent (57.6%), compared to the made during the year 2020.

EXPORTS, OVERVIEW

During the year 2021, exports at the national level totaled 92,155 million FOB dollars, and presented a growth of 29.6% compared to the previous year, caused in large part by the increase registered in shipments of copper minerals and their concentrates, which meant an increase of 8,375 million dollars in total sales in the country.
Regarding the means of transport, the maritime route remained the most used, mobilizing 97.2% of the total cargo in tons, while in second and third place were the road, land, and air transport routes, courier and postal, with a 2.1% and 0.7% share, respectively.
In relation to the countries that purchase our products, China ranked first, reaching a 38.4% share of the country’s total exports, followed by the United States (16.3%) and Japan (7.8%). ); In fact, 62.5% of total sales at the national level were made to these three countries of destination. Likewise, they highlighted the positive variations recorded in percentage terms by Taiwan (62.6%), Brazil (48.8%), and Spain (42.5%); while the most relevant setback was observed in Russia, registering a decrease of 10.7%.

Chilean Foreign Trade 2017 - 2021

(In millions of US$ FOB)

Main Products of Chilean Exports 2017-2021

(In millions of US$ FOB)

Exports by destination and sector, 2021

Agricultural, Forestry and Fishing Sector
Mining Sector
Industry Sector

Main Destination Countries of Chilean Exports 2021

(Share in percentage and Exports in millions of US$ FOB)

Agricultural, forestry and fishing exports

During 2021, forestry and agricultural exports grew by 5.7%, with China as the main destination with a 32% share. Indeed, 39% of the increase in total shipments in the sector was explained by higher shipments to China.
The United States was the second main buyer with a relative weight of 22%, slightly lower than the 23% registered in 2020.
With a growth of 6.3%, the European Union was the destination of 17% of the sector’s shipments.
The Latin American blocks experienced dissimilar results during the last year. On the one hand, agricultural, forestry and fishing exports to the countries of the Pacific Alliance grew by 13%, while shipments from the sector to the Mercosur countries fell by a similar percentage (-12%).

Mining Exports

In terms of amount and in percentage terms, mining exports were the ones that increased the most: US$16,924 million more than last year, which was equivalent to an increase of 41%.
China accounted for 47% of the increase in the sector’s shipments, after an increase of 35%. The Asian country concentrated 53% of Chilean mining exports, although in 2020 its participation was 55%.
Mining shipments to the United States doubled during the last year, surpassing Japan, which during 2020 was the second main destination in the sector. The relative weight of the United States increased from 7% to 12%.
Mining exports to Japan also increased in 2021 (+18%), although their share decreased from 10% to 8%.
Shipments to the European Union increased by more than one billion (+38%), positioning itself as the fourth largest buyer of Chilean mining products, although maintaining a concentration of 7%.
The fifth largest buyer in the sector was South Korea, which accounted for 6% of the minerals exported.

Industrial Exports

Chilean industrial exports grew by 16%, with the United States, concentrating 22% of the total (greater than its relative weight in 2020 equal to 20%).
Industrial shipments to China varied by only 0.7%, with which China went from representing 14% of the total to 12%.
Mercosur climbed two positions as the main recipient of the sector, thanks to an increase of close to one billion (+41%). In this way, its relative weight increased two percentage points to 12%.
Exports to the European Union grew by 9%, although it maintained its relative weight at 11%.
The Pacific Alliance increased its share of Chilean industrial exports from 10% to 11%, thanks to an annual increase of 21%.

Exports by Category 2017-2021

(In millions of US$ FOB)